
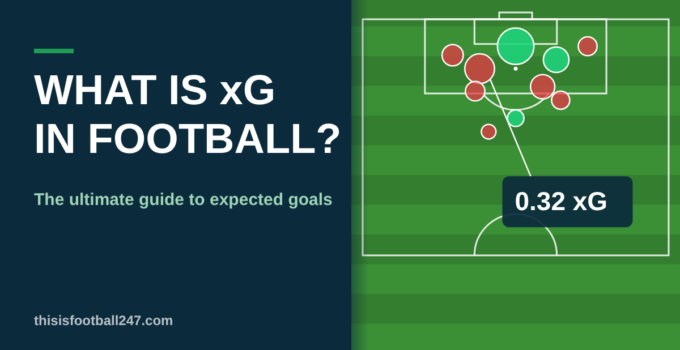
Ask ten football fans who deserved to win a match, and you will get ten different answers. Ask them again with the shots laid out in front of them, and the arguments change. That is the idea behind xG, or expected goals, the statistic that has become part of how we watch the game.
This guide covers everything, from what xG is and how it is calculated to what a good number looks like, where it falls down and who holds the records. If you want to see it in action, you can plot shots on a pitch and build your own match map with our free xG calculator.
What is xG in football?
xG is a number that measures the quality of a chance. Every shot is given a value between 0 and 1, which represents the probability that it will become a goal. A shot worth 0.2 xG should be scored about one time in five. A shot worth 0.8 should be scored four times in five.
Add up the values for every shot a team takes in a match, and you get its total xG. A team that finishes with 2.4 xG has created the sort of chances that an average team would turn into between two and three goals.
It matters because the scoreline is a blunt instrument. A match can end 1-0 when one side had 20 shots and the other had one, and xG is a way of seeing what the result hides. It does not tell you who won. It tells you who created the better chances.
What is the point of xG?
xG exists because goals are rare. In most Premier League matches, you see only two or three goals, but 25 to 30 shots. That is not much information to judge a team on, and a lucky deflection can distort the picture.
xG turns every shot into data, so you can answer questions that goals alone cannot. Is this team as good as its results suggest? Is that striker finishing above the average? Was that 1-0 win deserved?
It is also useful for the people who run clubs. Recruitment departments use it to find players who are getting into good positions, and analysts use it to judge whether a manager’s system is working. Liverpool were among the first clubs to build analysis around it.
For fans, I think its best use is as a referee for pub arguments. Instead of saying “we were robbed”, you can say “we had 2.8 xG to their 0.6”, and now you are on firmer ground.
How is xG calculated?
xG models are built from history. A data company collects hundreds of thousands of past shots, records where each was taken and how, and works out how often shots like it ended up as goals. Each new shot is then compared with that record, and the answer becomes its xG value.
The ingredients
The main factors are:
- Distance to goal: the closer the shot, the higher the value
- Angle: a central shot is worth more than one from a tight angle
- Body part: a shot with the foot generally beats a header from the same spot
- Type of play: open play, a set piece, a free kick or a penalty each have their own base rate
- The assist: a through ball, a cross or a rebound can change the value
More advanced models add whether the chance followed an error, whether it was labelled a big chance, and where the defenders and goalkeeper were at the moment of the shot. Opta’s original model, published in 2012, was built on hundreds of thousands of past shots and weighed up angle, location, assist type, the game situation and how close defenders were.
A worked example
Imagine a team takes five shots in a match, with these values:
| Shot | xG |
|---|---|
| 1 | 0.40 |
| 2 | 0.30 |
| 3 | 0.50 |
| 4 | 0.20 |
| 5 | 0.10 |
| Total | 1.50 |
The team’s xG for the match is 1.50. If they scored twice, they were a little lucky or clinical. If they scored none, they were unlucky or wasteful.
Why different sites show different numbers
Every provider builds its own model, so the same shot can get a different value. Opta, StatsBomb and Understat each train on their own data and weight the factors in their own way. The same shot can vary by up to about 0.1 between models, which is why xG totals for a match are rarely identical across sites. The best approach is to stick to one source when you compare teams.
Is a higher xG better?
For the team attacking, yes. A higher xG means a team has created better or more chances. It shows that the attack is working, even if the goals have not come yet.
But there are two caveats. First, a high total can come from many small chances. A team that takes 25 shots from distance might reach 1.5 xG without a single clear opening, and a team with three big chances can reach the same number. That is why average xG per shot is a useful companion, because it shows quality, not volume.
Second, defensively the rule is reversed. For xGA, which measures the chances a team concedes, lower is better. The best teams combine a high xG with a low xGA, and the difference between them, xG difference, is one of the cleanest ways to judge a side.
What is a good xG?
It depends whether you mean one shot or a whole match.
Per shot. The average shot in the Premier League is worth about 0.10. As a rule of thumb:
| xG of a shot | What it means |
|---|---|
| Below 0.05 | A speculative effort |
| About 0.10 | A half chance |
| 0.30 and above | A clear chance |
| Above 0.50 | A shot that should be scored more often than not |
| About 0.76 | A penalty |
A big chance is generally one worth about 0.3 xG or more, although some providers set the line a little higher, at around 0.38.
Per match. In a typical Premier League match, both teams together produce around 2.5 to 3.0 xG. For a single team:
| Team xG in a match | What it means |
|---|---|
| 2.0 or more | Excellent chance creation |
| 1.2 to 2.0 | A good performance |
| 0.8 to 1.2 | Average |
| Below 0.8 | Struggling to create quality chances |
These are guides, not laws. A team that creates 1.0 xG against a deep defence may have played very well.
Is a penalty 1 xG?
No. A penalty is worth about 0.76 xG in most models, which reflects the fact that around three in four are scored. Some providers use 0.79.
It is not 1.0 because penalties are missed and saved, and because the number is an average across all takers. The model does not know who is taking the kick, so a penalty from a nervous teenager and one from a seasoned taker get the same value.
This matters when you are looking at totals. A team that wins two penalties in a match adds about 1.5 xG from them alone, which can make a performance look better than it was. That is why analysts often use non-penalty xG, which strips them out.
If you’re comparing strikers, I’d always look at non-penalty xG first. A striker who takes his club’s penalties can look like an elite chance-getter when half his numbers came from the spot, and npxG cuts straight through that.
xG, xGA, npxG and the other expected stats
xG has a family of relatives. Here are the ones worth knowing:
| Stat | Full name | What it measures |
|---|---|---|
| xG | Expected goals | The quality of a team’s or player’s chances |
| xGA | Expected goals against | The quality of chances conceded |
| npxG | Non-penalty xG | xG with penalties removed |
| xGD | Expected goal difference | xG minus xGA |
| xGOT | Expected goals on target | The quality of a shot after it is struck, based on where it is placed in the goal |
| xPTS | Expected points | The points a team should have earned given its chances |
Of the group, npxG is the best for comparing players over a season, and xGD is the best for comparing teams. xGOT is different, because it looks at the shot after it is taken, and it is useful for judging finishing and goalkeeping.
xG football analysis
Using xG well is a skill. Here is how I would approach it.
Start with the match. Compare the two teams’ xG totals and the score. If they point in the same direction, the result was probably fair. If they do not, look at why. Brighton created 3.35 xG to Sheffield United’s 0.92 at the Amex in December 2020, and still failed to win. That is the sort of game xG exists to explain.
Look at the shots, not just the total. One 0.76 penalty and ten 0.07 long shots can add up to the same total as eight good chances. An xG map shows you where the shots came from, and an xG race chart shows when the chances arrived. You can build both in our xG calculator.
Zoom out to a season. Over 38 matches, a team’s xG and xGA tell you far more than the table. Liverpool are a good example: between 2021-22 and 2024-25 they created 341.55 xG and scored 341 goals, almost exactly what the model expected across four seasons.
Compare goals with xG. The gap between the two is the quickest way to spot a clinical finisher or a wasteful striker. Someone who consistently outscores his xG is probably an excellent finisher. Someone who underperforms is probably missing chances.
Look for trends before drawing conclusions. A single match is a small sample. A run of six or eight is far more reliable.
We cover how goals and xG diverge in more detail in our guide to xG vs goals.
Is xG a good predictor?
Partly, and that is the honest answer. Over a season, xG is a better guide to a team’s future results than goals scored, because it filters out some of the luck. A team with a strong xG difference but poor results is likely to improve. A team with good results but a weak xG difference is likely to fall back.
For a single match, it is much less reliable. A match with 1.3 xG against 1.2 suggests a 1-1 draw is a fair result, but football has plenty of room for surprises. The most useful way to think about it is that xG tells you what is likely, not what will happen.
One thing it does very well is to flag the teams and players whose results are not sustainable. That is why analysts watch for large gaps between goals and xG, and why they tend to shrink over time.
Why is xG flawed?
xG is useful, but it has real limits, and anyone who tells you otherwise is selling something.
- It ignores who takes the shot. The model values the chance, not the player, so a tap-in for a world-class striker and for a defender get the same number.
- It does not always see pressure. Simple models do not know how many defenders were close, or where the goalkeeper was standing.
- It only counts shots. Brilliant build-up that does not end in a shot, and the pass that creates a chance, get no credit unless the shot follows.
- Models disagree. The same shot can differ by up to about 0.1 between providers.
- Small samples mislead. One match, or even five, can be noisy.
- It averages the unusual. A truly unusual chance, such as a ball that sits up perfectly for a volley, gets the same value as an average one from that position.
My own view is that xG is best treated as a very good starting point, and never as the final answer. It is brilliant for spotting patterns, and poor at explaining individual moments.
After a few years of using xG every weekend, here’s where I think it’s brilliant and where I’d switch it off.
Best uses, in order:
- Judging a team over a season. Nothing beats xG difference for telling you who’s genuinely good.
- Spotting a hot streak that won’t last. A striker scoring far above his xG for ten games is due a dry spell.
- Settling a single “we were robbed” argument, as long as the gap is big.
Worst uses, in order:
- Judging a goalkeeper. xG says nothing about how hard a shot was to save. Use xGOT instead.
- Ranking creative midfielders. The pass before the assist gets no credit at all.
- Deciding a close game. A 1.3 against 1.1 match is a coin toss, and xG can’t tell you who deserved it.
Who has the highest xG in football?
There is no single list that covers the whole of world football, but the Premier League has good records.
Player, single season: Erling Haaland holds the Premier League record for a season, with 29.37 xG in 2023-24, according to StatMuse. What I find fascinating is that he only scored 27 goals that season, two fewer than the model expected. Mohamed Salah went the other way in 2024-25. StatMuse had him on 23.83 xG with four games still to play, and he finished on 29 goals, comfortably above what his chances were worth.
That’s the clearest lesson xG has to offer. The player who got the best chances in Premier League history didn’t have the best finishing season, and a winger who got fewer of them outscored him. One is about movement, the other is about finishing, and the best strikers need both.
Team, over four seasons. Liverpool created the most xG in the Premier League between 2021-22 and 2024-25, with 341.55 across 152 matches.
What is the lowest xG in the Premier League?
The answer depends on what you mean.
For a single shot, a chance can be worth as little as 0.01. Brentford’s Saman Ghoddos scored against Burnley from a chance rated at just 0.01 xG, according to xG Philosophy’s data, which is about as unlikely as a goal gets.
For a team in a match, it can be zero. A side that has no shots, or only hopeless ones, will finish with an xG of 0.0-something. Among teams that actually scored at least twice, the lowest figure since the start of 2016-17 was 0.13, recorded by Tottenham against Manchester City in August 2019 and Leeds against City in April 2021, according to Opta Analyst.
For a team across a season, the lowest totals tend to belong to relegated sides. As of April 2024, Sheffield United had the lowest xG in the Premier League, with 31.81 after 31 games, and Burnley were next on 33.95, according to Understat.
When was xG introduced in football?
The history is longer than most people think.
The term “expected goals” first appeared in 1993, in a paper by Vic Barnett and Sarah Hilditch about the effect of artificial pitches on home team performance. It was largely ignored by the football world for nearly 20 years, although the idea had earlier roots in ice hockey and other American sports analytics.
The modern version began in April 2012, when Opta analyst Sam Green published a blog post titled “Assessing the performance of Premier League goalscorers”, explaining a model inspired by American sports. It showed that shot quality mattered as much as shot quantity.
From there, it spread. Clubs built xG into their analysis, and the stat reached a mass audience in the 2017-18 season, when the BBC’s Match of the Day began using it. The reaction was mixed, with plenty of fans dismissing it as nonsense, but within a few years it was everywhere.
xG vs goals
xG and goals tell different stories. Goals are what happened. xG is what, on average, should have happened. Over a long period they tend to converge, but for individual players and short runs, the gap can be large and revealing. If you want to go deeper on the topic, read our guide to xG vs goals.
My Take on xG in Football
I think xG is one of the best things to happen to football conversation in the last 20 years. It has given fans a better way to talk about what they saw, and given clubs a better way to judge what they are doing. It will not settle every argument, but it makes most of them a bit more honest.
The best way to understand it is to use it. Take a match you watched, plot the shots, and see what the map says. You may find that your memory of the game was wrong, and that is half the fun.
My prediction is that within five years, the number you see on TV after a match won’t be xG at all, it’ll be xGOT. Fans care about whether a shot was saveable, not just whether the chance was good, and xGOT answers that. xG will still be the foundation, but it’ll be the number the analysts use, not the one on the screen.