
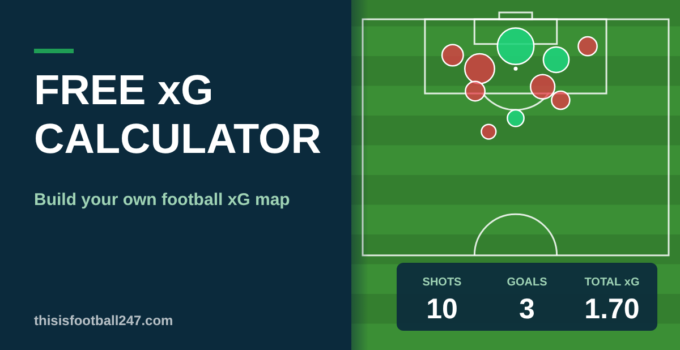
Did your team deserve that result, or did they nick it? Our free xG calculator lets you plot every shot from a match, see the expected goals (xG) for each one, and find out who really deserved to win. Add both teams, follow the xG race minute by minute, then download your xG map or share it with your mates.
Tap the pitch to place a shot. Top half is the home team, bottom half is the away team.
xG zones shade the pitch by how likely a normal shot from each spot is to go in.
Match stats
xG race chart
Players
Free xG calculator
The xG calculator is completely free. There’s no sign-up and no limit on how many shots or matches you plot. It works on your phone, tablet or laptop, and it saves your match automatically so you can come back to it later.
What you can do with the xG Football Map
- Plot shots for both teams on one pitch, with your own team names and colours
- See the distance, angle and xG of every shot as you place it
- Add the player, minute, body part, situation, assist type and outcome
- Get a live score in goals and xG, plus each team’s chance of winning
- Track the match with an xG race chart
- See a full stats comparison and a breakdown for every player
- Turn on xG zones to see how dangerous each area of the pitch is
- Download a branded image of your xG map, or export every shot to a spreadsheet
- Share a link so anyone can open and edit your xG map
How to use the xG calculator
- Add your teams. In the Teams tab, enter the home and away team names and pick their colours. The home team shoots at the top goal and the away team at the bottom.
- Place a shot. Tap where the shot was taken. Tap the top half for a home team shot and the bottom half for an away team shot. You’ll see the distance, angle and xG straight away.
- Add the details. Choose the body part, situation, assist and outcome, and add the minute and the player if you know them. Each one changes the xG, just like in professional models.
- Press Add shot. Repeat for every shot in the match. Tap any shot to edit or delete it, drag it to move it, or press Undo.
- Download or share. Download your xG map as an image, export the shots as a CSV file, or copy the share link.
Best xg football calculator
Most xG calculators give you a number for one shot and stop there. We built ours to tell the full story of a match.
What makes a good xG calculator?
A good xG calculator should be quick to use, account for more than just distance, and show you what the numbers actually mean. Ours considers the shot’s distance, the angle to goal, the body part, the situation and how the chance was created. It then turns those numbers into a result you can understand: who deserved to win.
Two-team xG maps and a race chart
Plot both teams on one full pitch and you’ll get the match score in goals and xG, side by side. The xG race chart shows how each team’s xG built up minute by minute, with a marker for every goal, so you can see exactly when the game swung.
Win probability and expected points
Based on the chances each team created, the calculator works out how often each side would win, draw or lose if the match were played again, along with each team’s expected points. It’s the quickest way to settle “we were robbed” arguments.
A transparent xG model
Many xG numbers arrive without any explanation. Ours explains what goes into each value, so you can see why a six-yard tap-in is worth far more than a shot from 30 yards. If you understand the model, you can trust the output, and you can spot when it might be misleading.
Built for mobile, free to download
You should be able to build a shot map on your phone while watching the match, and then download it as an image to share in the group chat. The calculator is free, works on mobile and lets you save your map.
xG map football
An xG map is a picture of a match’s chances. Each shot is a dot on the pitch, and the size or shade of the dot shows how likely it was to be a goal.
How to read an xG map
Each dot is one shot, in the team’s colour.
Bigger dots mean higher xG, so a tap-in is a big dot and a 30-yard hopeful effort is a small one.
A solid dot with a white ring is a goal. A faded dot was saved, and an empty ring was blocked or off target. A dashed ring hit the woodwork.
A small “H” marks a header.
Comparing both teams on one map
The home team’s shots are in the top half and the away team’s in the bottom half, so you can compare the two at a glance. Lots of big dots clustered in the box means a team created real chances. Lots of small dots outside the box means they were shooting from distance and hoping.
The xG race chart explained
The race chart adds up each team’s xG as the match goes on. A big jump means a big chance, and a dot on the line marks a goal. If one team’s line is well above the other’s but they lost, you know the result didn’t match the performance.
Using xG zones
Turn on xG zones in the Teams tab to shade the pitch by how likely a normal shot from each area is to go in. The red area right in front of goal is where the best chances come from. It’s a great way to see why some shots are worth so much more than others.
How xG is calculated
Models are built by looking at hundreds of thousands of historical shots. For each new shot, the model asks how often similar shots from that position, with that type of delivery, ended up as goals. The answer becomes the xG value.
Add up the values for every shot a team takes, and you get their total xG for the match. A team that finishes with 2.4 xG would be expected, on average, to score between two and three goals from those chances.
How our xG model works
Our calculator uses a logistic regression model, the same type of model most xG providers use. It starts with the distance to goal and the angle between the posts, then adjusts for:
- Body part: headers and other body parts are harder to score than shots with the foot.
- Situation: fast breaks increase xG. Corners and direct free kicks lower it.
- Assist type: through balls and cutbacks raise xG. Crosses lower it.
- Penalties: these get a fixed xG of 0.78, close to the figure most data providers use.
As a guide, a central shot from 20 metres comes out at about 0.07 xG, an open-play shot from the penalty spot at about 0.23, and a shot from six yards at about 0.56.
xG stats football
xG is the headline number, but there are several related stats worth knowing.
xG vs actual goals
The gap between goals scored and xG is the quickest way to see whether a team or player is overperforming or underperforming. A striker who scores 15 from 10 xG is finishing above the average, and one who scores five from 10 is wasting chances. We cover the topic in more depth in our guide to xG vs goals.
xGA (expected goals against)
xGA measures the quality of the chances a team concedes. It works in the same way as xG, but defensively. A team with a low xGA is hard to create chances against, and the difference between xG and xGA gives you the expected goal difference.
Non-penalty xG (npxG)
Because a penalty is worth about 0.76, a team that wins a few can inflate its xG total. Non-penalty xG removes them, which gives a cleaner picture of open-play and set-piece chances. It is the better number for comparing players and teams over a season.
xG football analysis
Used properly, xG gives you a much better read on matches and players than the scoreline alone.
Did the better team win?
Compare the goals with the xG. If a team won 1-0 but lost the xG battle 0.6 to 2.4, they rode their luck. The win probability tells you how often they’d win that game if it were played again.
Spotting clinical finishers and wasteful strikers
Over a season, compare a player’s goals with his xG. A consistent gap in his favour suggests elite finishing, and a gap against suggests wasted chances. Remember that finishing luck evens out over time, so a big overperformance is often followed by a dip.
The limits of xG
xG is useful, but it is not perfect. It does not know who is taking the shot, so a chance for a world-class striker and one for a defender get the same number. It usually does not know how much pressure a player was under, and it ignores everything that does not end in a shot. Over small samples, results can also be noisy.
The best advice is to use it as a guide, and never as the whole story.
Xg map football premier league
Our calculator does not use live Premier League data. Instead, it lets you recreate any match by plotting the shots yourself, which is a good way to understand a game and to see how a team’s chances really looked.
How to recreate a Premier League xG map
Pick any Premier League match, pull up the highlights or a match centre that shows where shots were taken, and plot each one. Add the minute, the player and the outcome, and you’ll have your own Premier League xG map, ready to download and post.
Using xG to judge a Premier League season
Plot your team’s matches over a few weeks and you’ll see whether they’re genuinely creating chances or just getting lucky. A team regularly winning the xG battle but dropping points is usually due a turnaround.
Xg map football predictions
The calculator itself does not predict anything. It measures chance quality in matches that have already happened. But xG is one of the most useful tools for making better predictions.
Can xG predict results?
No single match is predictable, but xG is one of the best indicators of future performance. Teams that consistently create more xG than they concede tend to climb the table over time, whatever their current results say.
Using xG to predict the league table
To project a table, start with each team’s xG for and against. Use them to estimate how many points they should have, and compare that with their actual total. Teams who are well above their expected points often slip back, and teams well below often recover.
Then test the scenarios. Enter the results into our Premier League table calculator to see how the standings would change, or use the Championship table calculator for the second tier. Together, xG and the calculators give you a much better view of where a season might end up.
Is the xG calculator free?
Yes. The calculator is free to use, no sign up required and you can download your finished map at no cost.
How accurate is the xG calculator?
It is as accurate as a simple shot-quality model can be. It uses the main factors that affect a chance, but it does not see defenders or know who took the shot. Treat it as a way to understand matches, not a perfect forecast.
What is the xG of a penalty?
Most models put a penalty at about 0.76, which means roughly three in four are scored. Some use 0.79.
Can I download my xG map?
Yes. Once you have plotted your shots, you can download the map as an image to share or save.
Does it work on mobile?
Yes. The calculator is built to work on phones as well as desktop, so you can plot shots while you watch the game.

