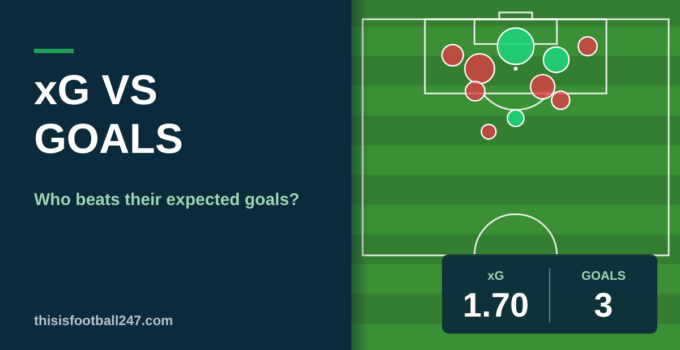
Every striker has a number next to his name showing how many goals he’s scored. Fewer fans look at the other number, the one showing how many he should have scored. I think the gap between the two is one of the most useful things in football, because it tells you whether a player is genuinely clinical or just having a lucky run, and whether a team is as good as its league position.
If you want to see it for yourself, you can plot a match’s shots in our free xG calculator and compare the result with the scoreline. Below is how to read the gap, why it appears, who it flatters and what it can tell you about the season ahead.
What Does xG vs Goals Mean?
xG, or expected goals, measures the quality of the chances a player or team has had. Goals are what they actually scored. Putting them side by side shows whether the finishing matched the chances. If you want the full background, start with our guide to what xG is in football.
The calculation is simple. Subtract xG from goals. A positive number means they scored more than expected, a negative number means fewer, and zero means they scored exactly what the chances suggested.
Overperforming your xG
A player or team overperforms when goals are higher than xG. Son Heung-min was a classic example at the halfway point of 2023-24, when he had scored 12 Premier League goals from an xG of just 7.12, a swing of nearly five goals in his favour. It can mean excellent finishing, such as shooting accurately into the corners, or it can mean luck. Often it is a bit of both.
Underperforming your xG
Underperformance is the opposite. At the same stage of that season, Darwin Núñez had scored five from an xG of 8.66 and Chelsea’s Nicolas Jackson seven from 10.59. They were getting into good positions, but the ball was not going in. Underperformance can signal poor finishing, but it can also be a stretch of bad luck that will turn.
Why Do Goals and xG Differ?
If xG is an average, why do real results vary from it? There are four main reasons.
Finishing quality
xG assumes an average player is taking the shot. A great finisher will convert more than the model expects, and a poor one will convert fewer. That is why the gap is often read as a measure of skill, and why elite strikers tend to sit a little above their xG over long periods.
Goalkeeping
On the other side of every shot is a goalkeeper. A brilliant save keeps a goal out, and a howler lets one in. At team level, a top goalkeeper can make a side concede fewer goals than its xGA suggests, and a poor one can do the opposite. Some data providers measure this directly with expected goals prevented, which compares the goals a keeper conceded with the shots he faced.
Luck and small samples
This is the biggest factor, and the one fans tend to underrate. A deflection, a post, a mistake: all of them can move a single match, or even a run of five or six, far from the average. Over a few games, xG and goals can be very far apart. The shorter the period, the more luck matters.
Game state and shot choice
Teams do not take shots in a vacuum. A side that is chasing the game will take more speculative efforts, and a side protecting a lead will wait for cleaner chances. Players also choose to shoot or pass, and a team that shoots from awkward positions will see its goals fall short of its xG. Simple models do not always capture this.
xG vs Goals in the Premier League
The Premier League gives us plenty of examples, and they show how much the gap can move.
Players who consistently beat their xG
Mohamed Salah is the usual example. Well… was. but he’s also a good reminder that nobody does it every year. In 2017-18 he scored 32 league goals from about 22 xG, one of the biggest overperformances on record. In 2022-23 and 2023-24 he was slightly below, with 19 from about 21.7 and 18 from about 21.2. In 2024-25 he was back above, with 29 goals from about 24.7. Elite finishers tend to beat their xG over time, but not in every single season.
Son is another name that comes up, and Isak scored 23 from around 20.3 xG in 2024-25, a gain of nearly three goals. Jarrod Bowen was also among the overperformers at the halfway point of 2023-24, with 11 goals from 7.36.
Players who usually fall short of their xG
Núñez and Jackson are the standard cases, because their numbers have been below xG for long stretches. Dominic Calvert-Lewin was the worst offender at the halfway point of 2023-24, with a gap of nearly four goals.
Handle these labels with care. Evanilson ended 2025-26 with an underperformance of 4.45 goals. Igor Thiago is the best example of why one bad run isn’t a verdict: he’s been the league’s biggest underperformer early this season, but last season he scored 22 league goals for Brentford from around 20.6 xG, according to FotMob, finishing second only to Haaland. I’d back him to be back above the line by spring.
Teams that outperformed their xG over a season
Nottingham Forest are the best recent example. In 2024-25 they scored 58 goals from an xG of 46.85, an overperformance of more than 11 goals, and qualified for Europe. A year later, they scored 48 from 47.21 and finished 16th.
Aston Villa did something similar in 2025-26, scoring 56 from 48.46. Liverpool’s 2024-25 title-winning side, by contrast, scored 86 from 85.25, almost exactly what their chances suggested. It is a useful contrast, because it shows that great teams do not need to be lucky.
At the other end, Brentford scored 55 from 59.93 in 2025-26, and Leeds 49 from 53.93, both underperforming by about five goals.
Here’s how those five seasons line up when you work out the gaps:
| Team | Season | Goals | xG | Gap |
|---|---|---|---|---|
| Nottingham Forest | 2024-25 | 58 | 46.85 | +11.15 |
| Aston Villa | 2025-26 | 56 | 48.46 | +7.54 |
| Liverpool | 2024-25 | 86 | 85.25 | +0.75 |
| Brentford | 2025-26 | 55 | 59.93 | -4.93 |
| Leeds United | 2025-26 | 49 | 53.93 | -4.93 |
The quirk that jumped out when I lined these up is Brentford and Leeds. Both missed their xG by exactly 4.93 goals last season. And Brentford did it while Thiago was beating his own xG, so the shortfall came from everyone else in the side.
For me, the Liverpool row is the most impressive on the page. Winning a title by scoring almost exactly what your chances deserved means there was no luck in it at all.
xG vs Goals Prediction
This is where the numbers get most useful, because the gap is a clue to what might happen next.
Does overperformance last?
Usually not, at least not in full. Finishing skill is real, but it is a small effect compared with luck. Forest’s drop from +11 to roughly level is a textbook example. Bryan Mbeumo and Chris Wood were two of the biggest overperformers in 2024-25, with gaps of about 7.5 and 6.6, and early in the next season Mbeumo and Matheus Cunha had just one goal between them from 3.26 xG.
Regression to the mean explained
Regression to the mean is the tendency for extreme results to move back towards the average. If you flip a coin ten times and get eight heads, you would not expect eight in the next ten. The same is true in football. A striker who scores 20 from 13 xG has probably been both good and lucky, and next season is likely to look a little more normal.
The same applies in reverse. A team or player with a big shortfall is more likely to improve than to get worse, as long as they keep creating chances.
Using xG vs goals to predict the table
The method is simple. For each team, compare goals scored with xG, and goals conceded with xGA. Teams that have scored far more than their xG, or conceded far fewer than their xGA, are the ones most likely to fall back. Teams that have done the opposite are candidates to rise.
You can then test the scenarios. Enter the results and the fixtures into our Premier League table calculator to see how the standings might change if a lucky team’s results cool off. The numbers will not predict the table for you, but they give you a much better starting point than the current league position.
How to Compare xG and Goals Yourself
You do not need a data subscription. Here is how to do it.
- Pick a match. Watch the highlights or a replay.
- Plot the shots. Use our xG calculator to plot every shot from the match and see each team’s total.
- Subtract. Goals minus xG gives you the swing. Do it for both teams.
- Check the shots. A big gap from one penalty or one long-range screamer tells you something different from a gap spread across many chances.
- Zoom out. Repeat across a run of matches, or a season, to see whether the pattern holds.
For players, use non-penalty goals and non-penalty xG, which removes the distortion of penalties. And always remember sample size. Ten shots tell you almost nothing, and a few hundred begin to tell you something real.
Is it good to outperform xG?
In the short term, it means you are winning games you might not have. Over a long period, it can be a sign of elite finishing. But a large gap in one season is more often a sign of luck, and you should not count on it to continue.
Which is a better predictor, xG or goals?
xG, for most purposes. Over a reasonable number of matches, it is a better guide to a team’s future results than goals scored, because it filters out some of the luck. Goals tell you what happened, and xG tells you what is more likely to happen next.
My Take
I’ve lost count of the number of times I’ve heard a pundit call a striker “clinical” after a hot month, only for him to go missing by Christmas. The gap between goals and xG is the best early warning football has, and I wish more people used it.
My prediction for this season is Aston Villa. They beat their xG by more than seven goals last season, and the closest precedent we have is Forest, who went from 11 goals above their xG to almost exactly level a year later, and from seventh to 16th. I don’t think Villa will fall that far, but I’d be surprised if they score as freely this season.